CVPR 2026
Abstract
Key Contributions
- We propose FluoCLIP, a two-stage ordinal vision–language framework that learns stain-specific grounding and stain-guided ranking for robust FQA.
- We introduce FluoMix, a new dataset featuring diverse fluorescent stains and tissue-level focus variations, providing the first dataset for stain-aware FQA in fluorescence microscopy.
- We formulate the task of Stain-Aware FQA in fluorescence microscopy, highlighting the need to model stain-dependent focus behavior.
FluoMix: A Dataset for Stain-Aware FQA
Existing datasets for focus quality assessment are limited in scope and fail to represent the diversity of fluorescence microscopy. To address this, we introduce FluoMix, a multi-tissue, multi-stain dataset specifically designed for stain-aware FQA. FluoMix aggregates fluorescence microscopy images across brain, lung, and liver tissues to capture diverse optical and biological characteristics. Each field of view includes up to four distinct stains and is acquired as a complete z-stack (covering the full range from sharp to severely blurred slices). By reflecting the spatial and biological heterogeneity of real tissue specimens, FluoMix establishes a practical foundation for robust, stain-aware focus assessment.
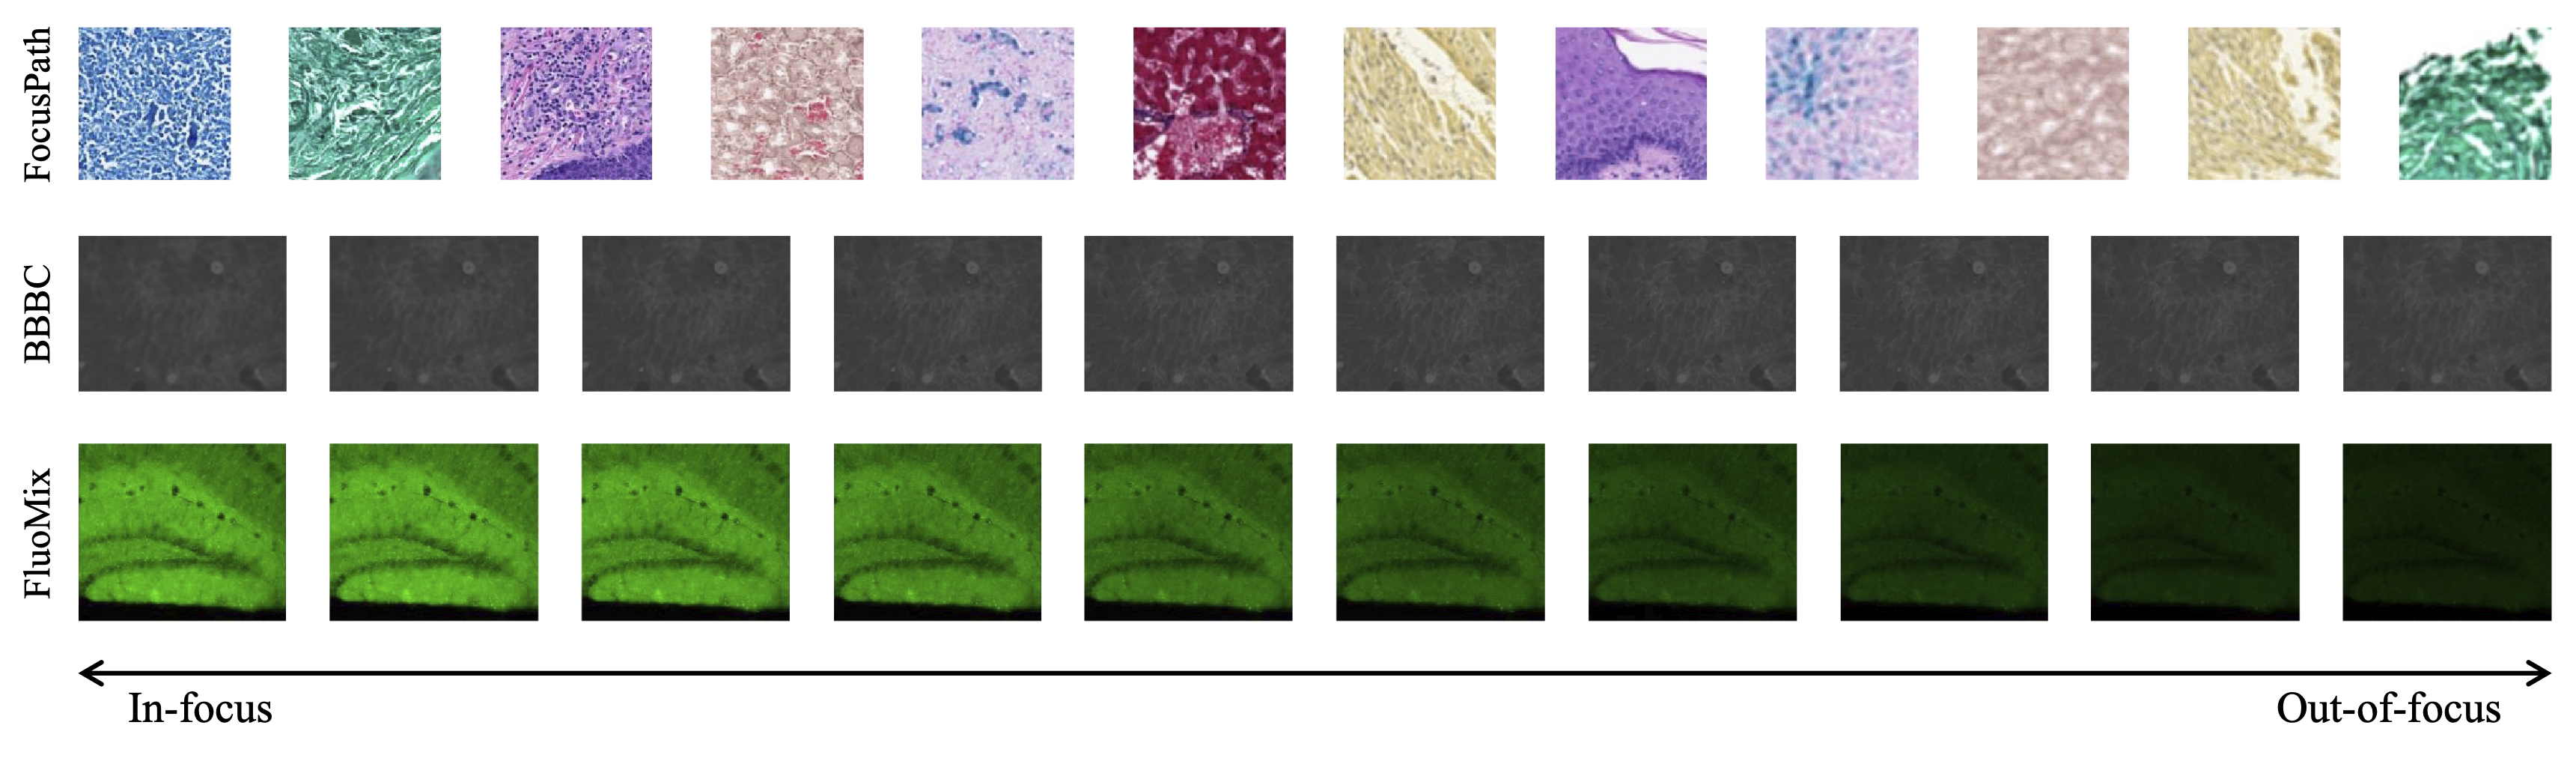
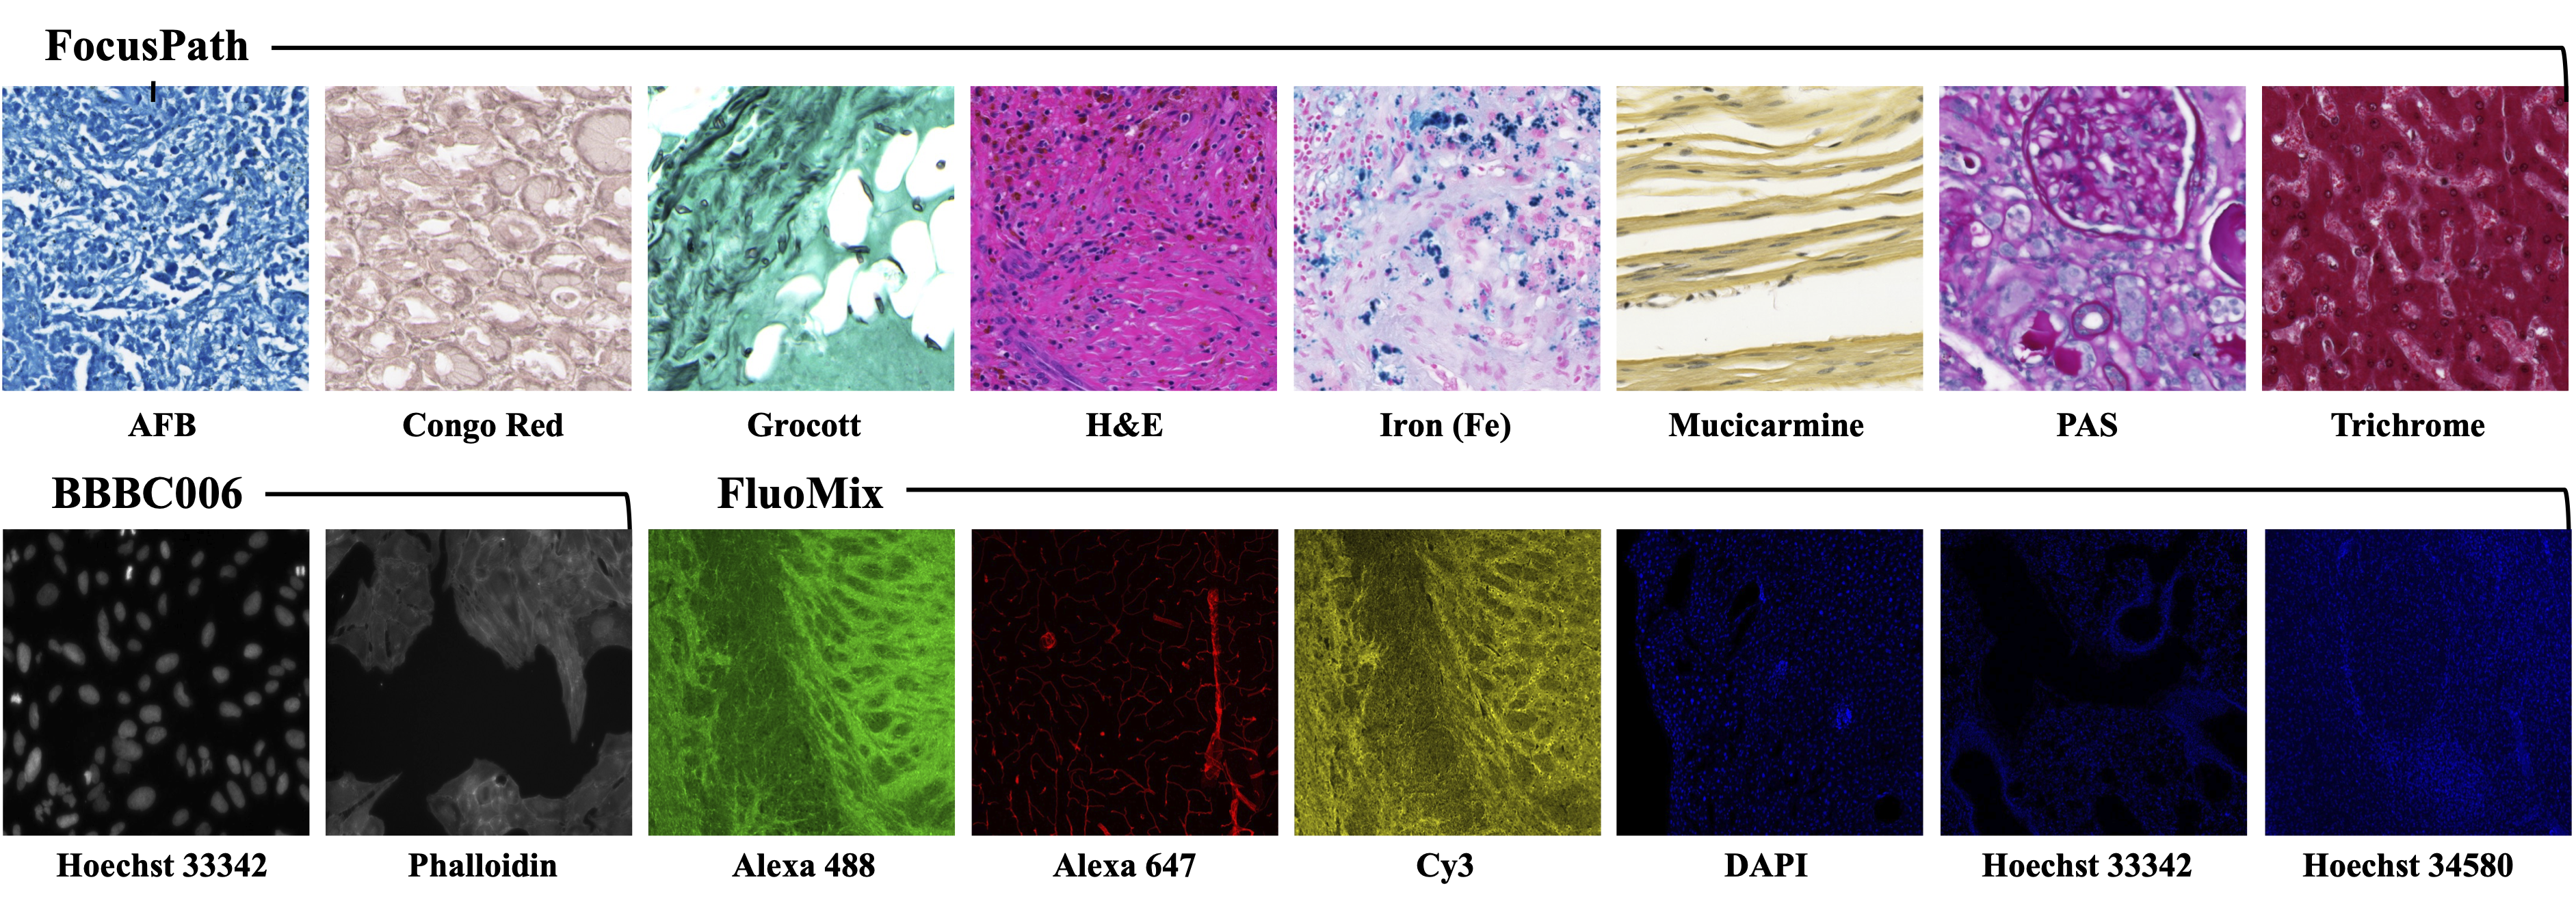
Figure 1 : (Left)Examples of dataset classes and (Right)Sample images illustrating stain diversity in the three datasets.
Table 1: Overview of the FluoMix dataset. Each stain is paired with distinct protein markers, reflecting the heterogeneity of signals across tissues.
| Brain Tissue | |||||
|---|---|---|---|---|---|
| Dataset | Hoechst 34580 | Alexa 488 | Cy3 | Alexa 647 | # Sets |
| D1 | nucleus | Iba-1 | Tuj-1 | Collagen IV | 504 |
| D2 | nucleus | NFM | TH | Collagen IV | 152 |
| D3 | nucleus | NeuN | TH | Collagen IV | 554 |
| D4 | nucleus | GFAP | Tuj-1 | CD31 | 623 |
| Lung Tissue | |||||
| D5 | nucleus | CD31 | Vimentin | Collagen IV | 634 |
| D6 | nucleus | CD31 | Vimentin | Collagen IV | 596 |
| Liver Tissue | |||||
| D7 | nucleus | CK19 | Claudin | ZO-1 | 96 |
FluoCLIP: Stain-Aware FQA Framework
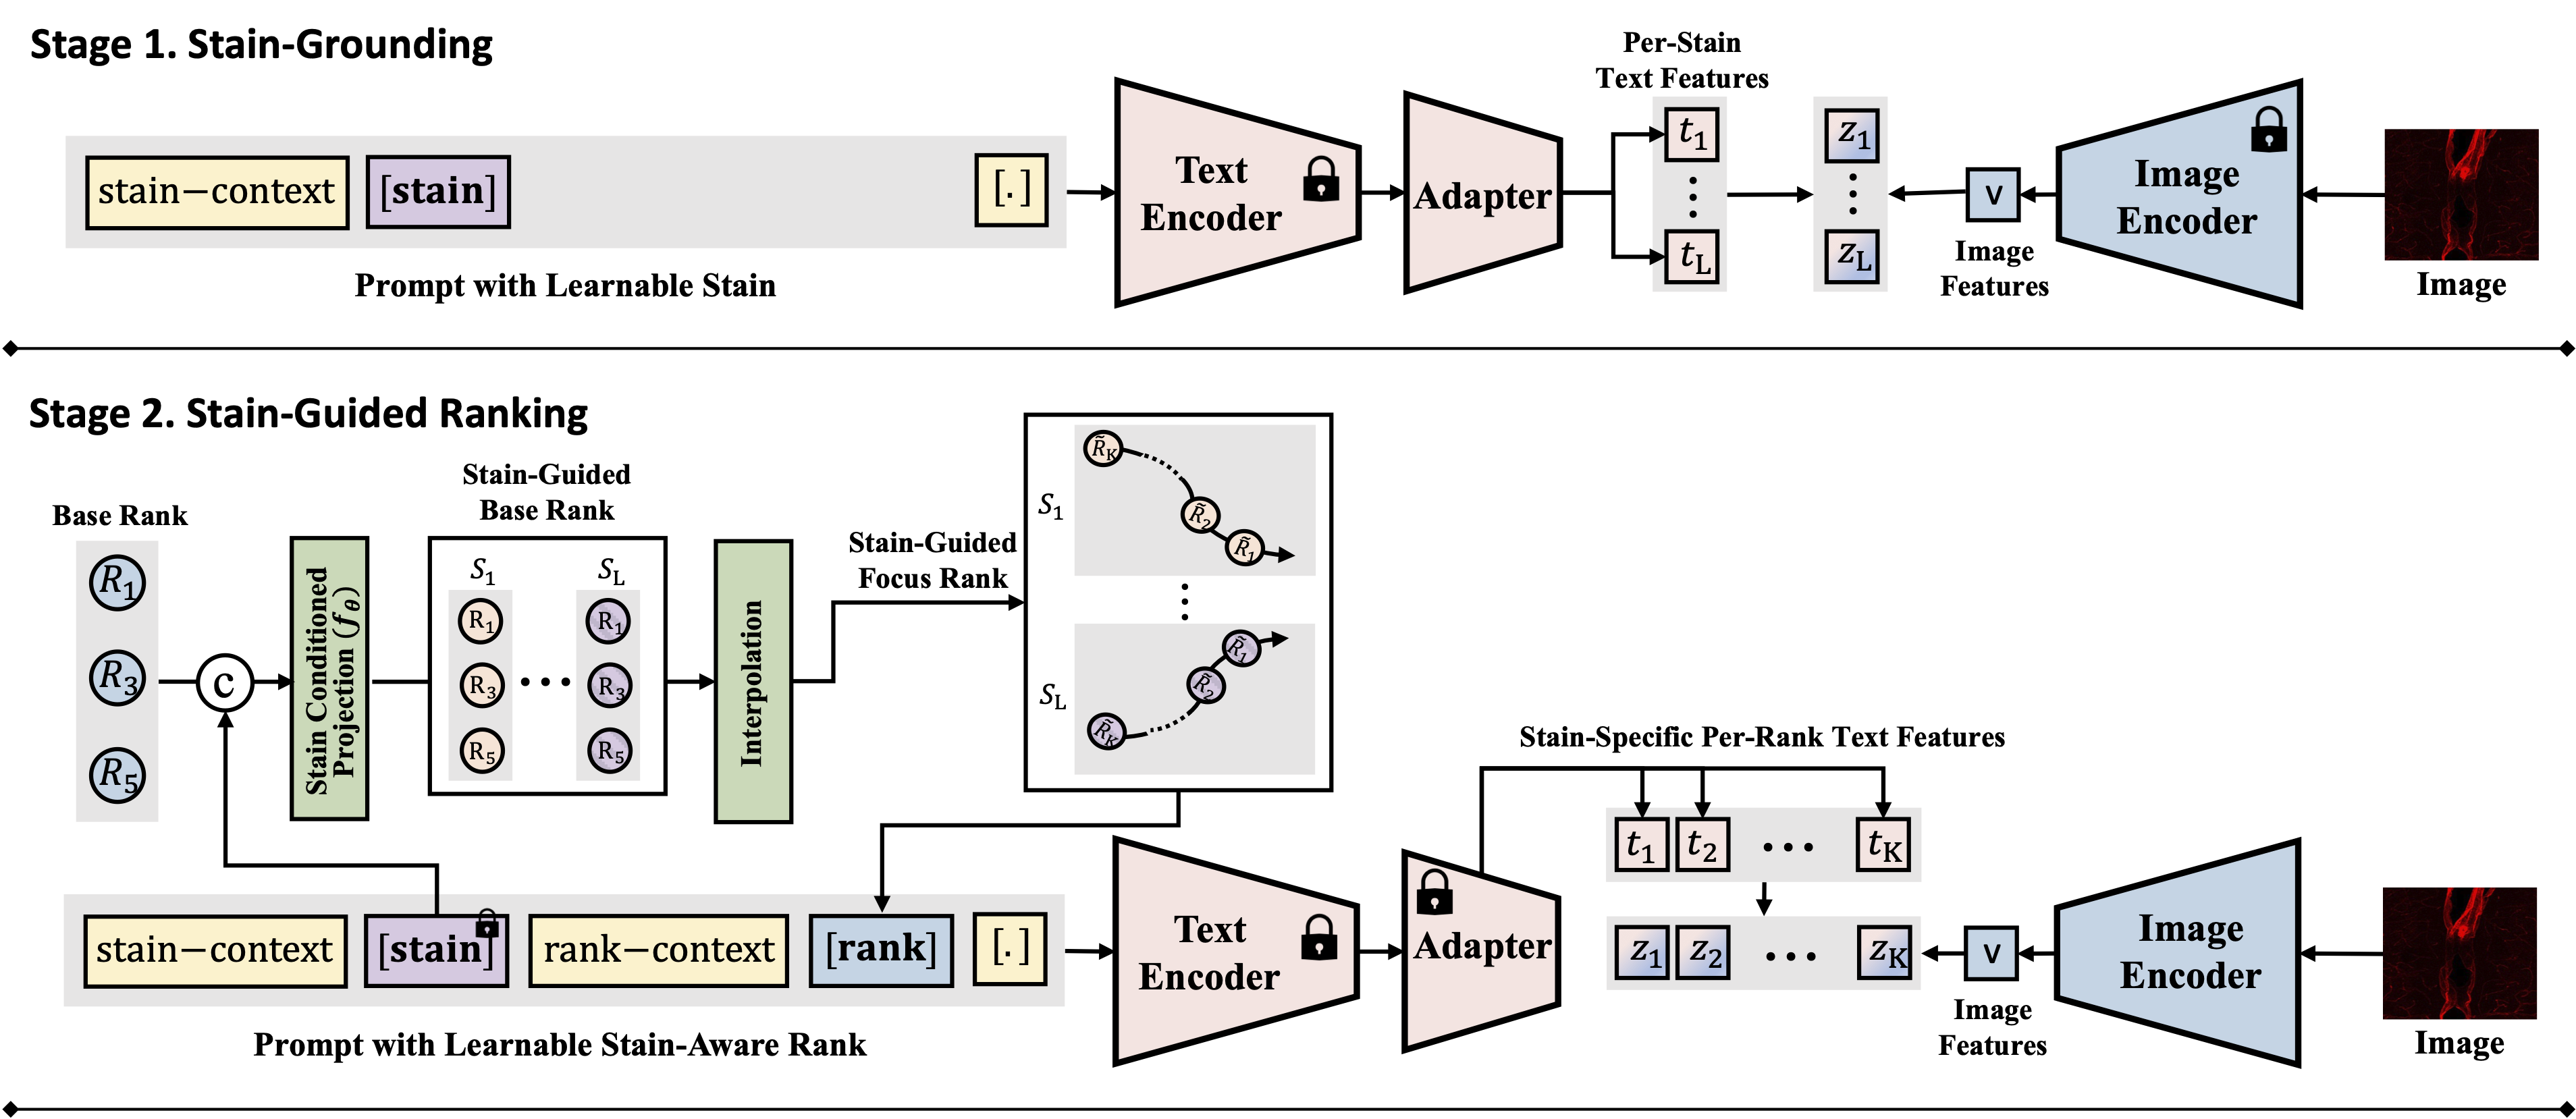
Figure 1: Overview of the FluoCLIP framework, featuring Stage 1 (Stain-Grounding) and Stage 2 (Stain-Guided Ranking).
To handle the heterogeneous focus degradation unique to fluorescence imaging, we propose FluoCLIP, a two-stage vision-language framework:
- Stage 1: Stain-Grounding: The model aligns learnable stain tokens with CLIP visual representations so that the text encoder acquires fluorescence-specific semantics. We freeze the pretrained text encoder and attach a compact adapter that learns stain-specific attributes, preserving linguistic consistency while enabling domain adaptation.
- Stage 2: Stain-Guided Ranking: The learned stain embeddings are used to condition focus prediction on stain-dependent appearance variations. A conditioning network projects base rank embeddings into a stain-guided space, and intermediate ranks are obtained through interpolation. This allows the model to modulate its focus perception according to the unique characteristics of each fluorophore.
Table 2: Ablation study on FluoCLIP components on the FluoMix dataset. We evaluate the contribution of grounded stain tokens ($S$) and stain-guided rank modules ($\tilde{R}^S$).
| Type | Configuration | $S^{\text{plain}}$ | $S^{\text{train}}$ | $S$ | $R$ | $\tilde{R}^S$ | Acc. (%) | Step Gain | Total Gain |
|---|---|---|---|---|---|---|---|---|---|
| (A) | Baseline (OrdinalCLIP) | ✓ | 83.12±0.41 | - | - | ||||
| (B) | (A) + Plain Stain Token | ✓ | ✓ | 83.21±3.93 | 0.09 | - | |||
| (C) | (A) + Learnable Stain Token | ✓ | ✓ | 81.38±0.63 | -1.74 | - | |||
| (D) | (A) + Grounded Stain Token | ✓ | ✓ | 84.28±0.88 | 1.16 | 1.16 | |||
| (E) | (D) + Stain-Guided Rank Token | ✓ | ✓ | 85.21±0.88 | 0.93 | 2.09 |
Empirical Analysis of Stain-Dependent Focus Behavior
The mean SF values exhibit a generally monotonic decrease as the focus level moves from in-focus to defocused regions across all three datasets. This confirms that the SF metric can reasonably capture the overall directionality of focus degradation implied by the ordinal labels, validating its use as a quantitative sharpness indicator for subsequent analysis.
We then analyze the distribution of the SF metric across different stains within each dataset. In FocusPath, which consists of bright-field H&E-stained whole-slide images, the per-stain variance is modest, with stains exhibiting closely aligned SF ranges and largely overlapping distributions, indicating stain-invariant focus behavior. In contrast, BBBC006 and FluoMix exhibit substantial stain-dependent variability. Different fluorescent stains occupy distinct SF ranges with largely non-overlapping variances, demonstrating that focus degradation is highly stain-dependent in fluorescence microscopy.
This observation supports the hypothesis that focus quality should be modeled as a function of stain characteristics rather than assuming a universal focus-rank mapping.
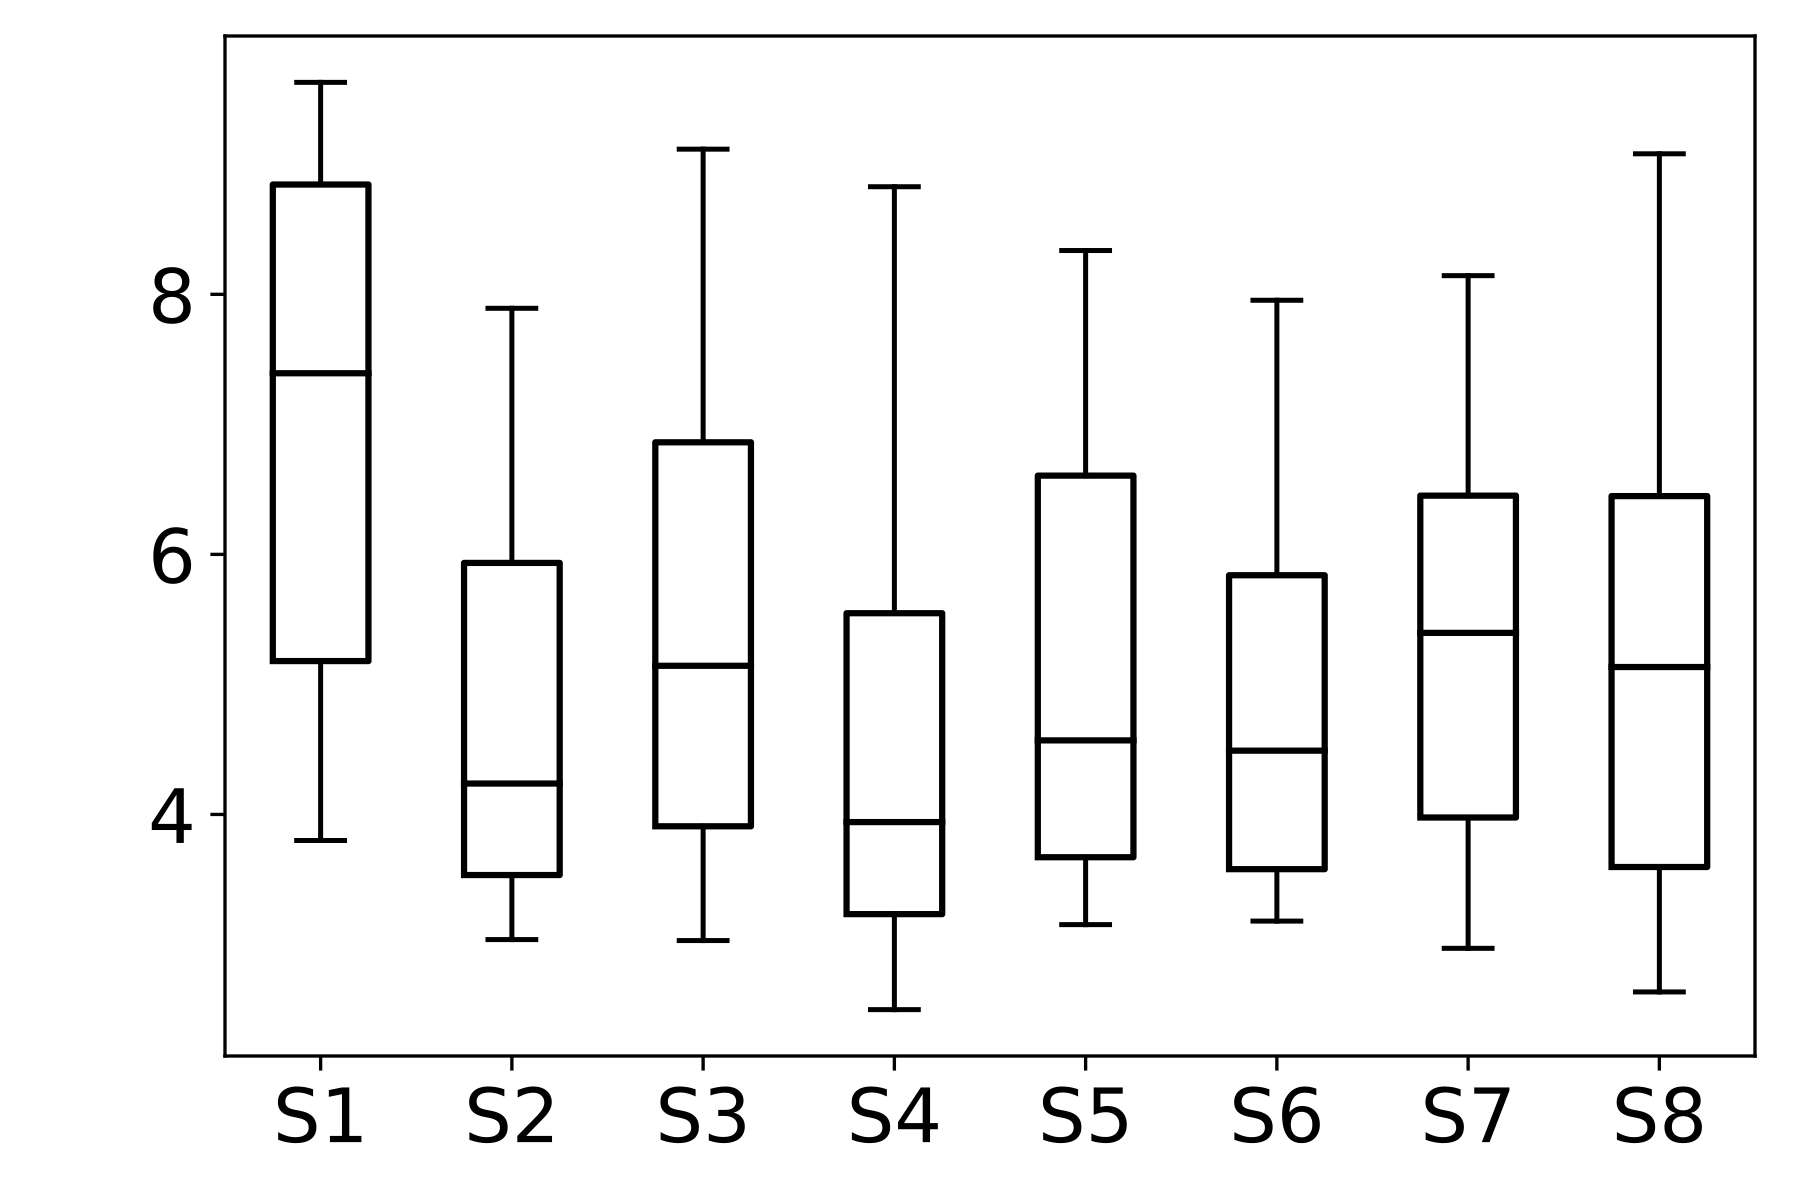
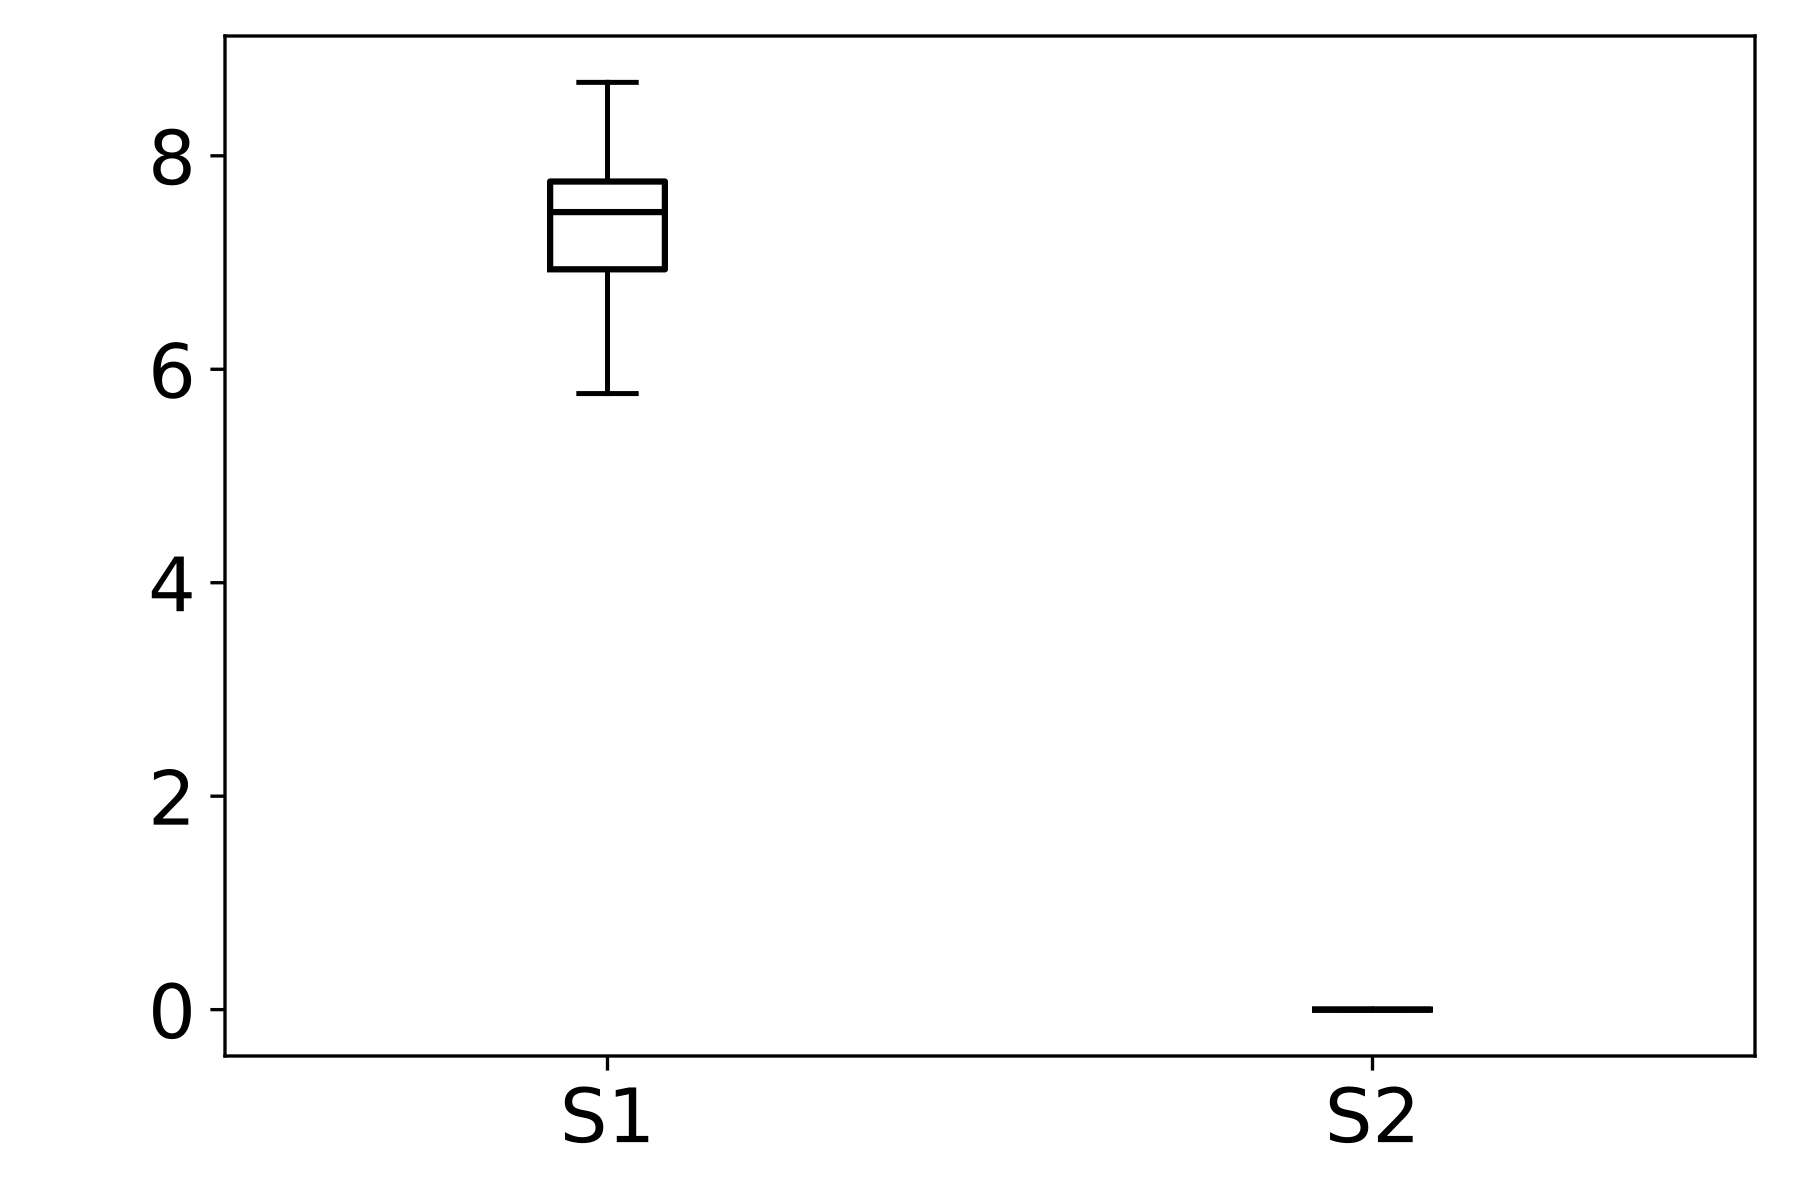
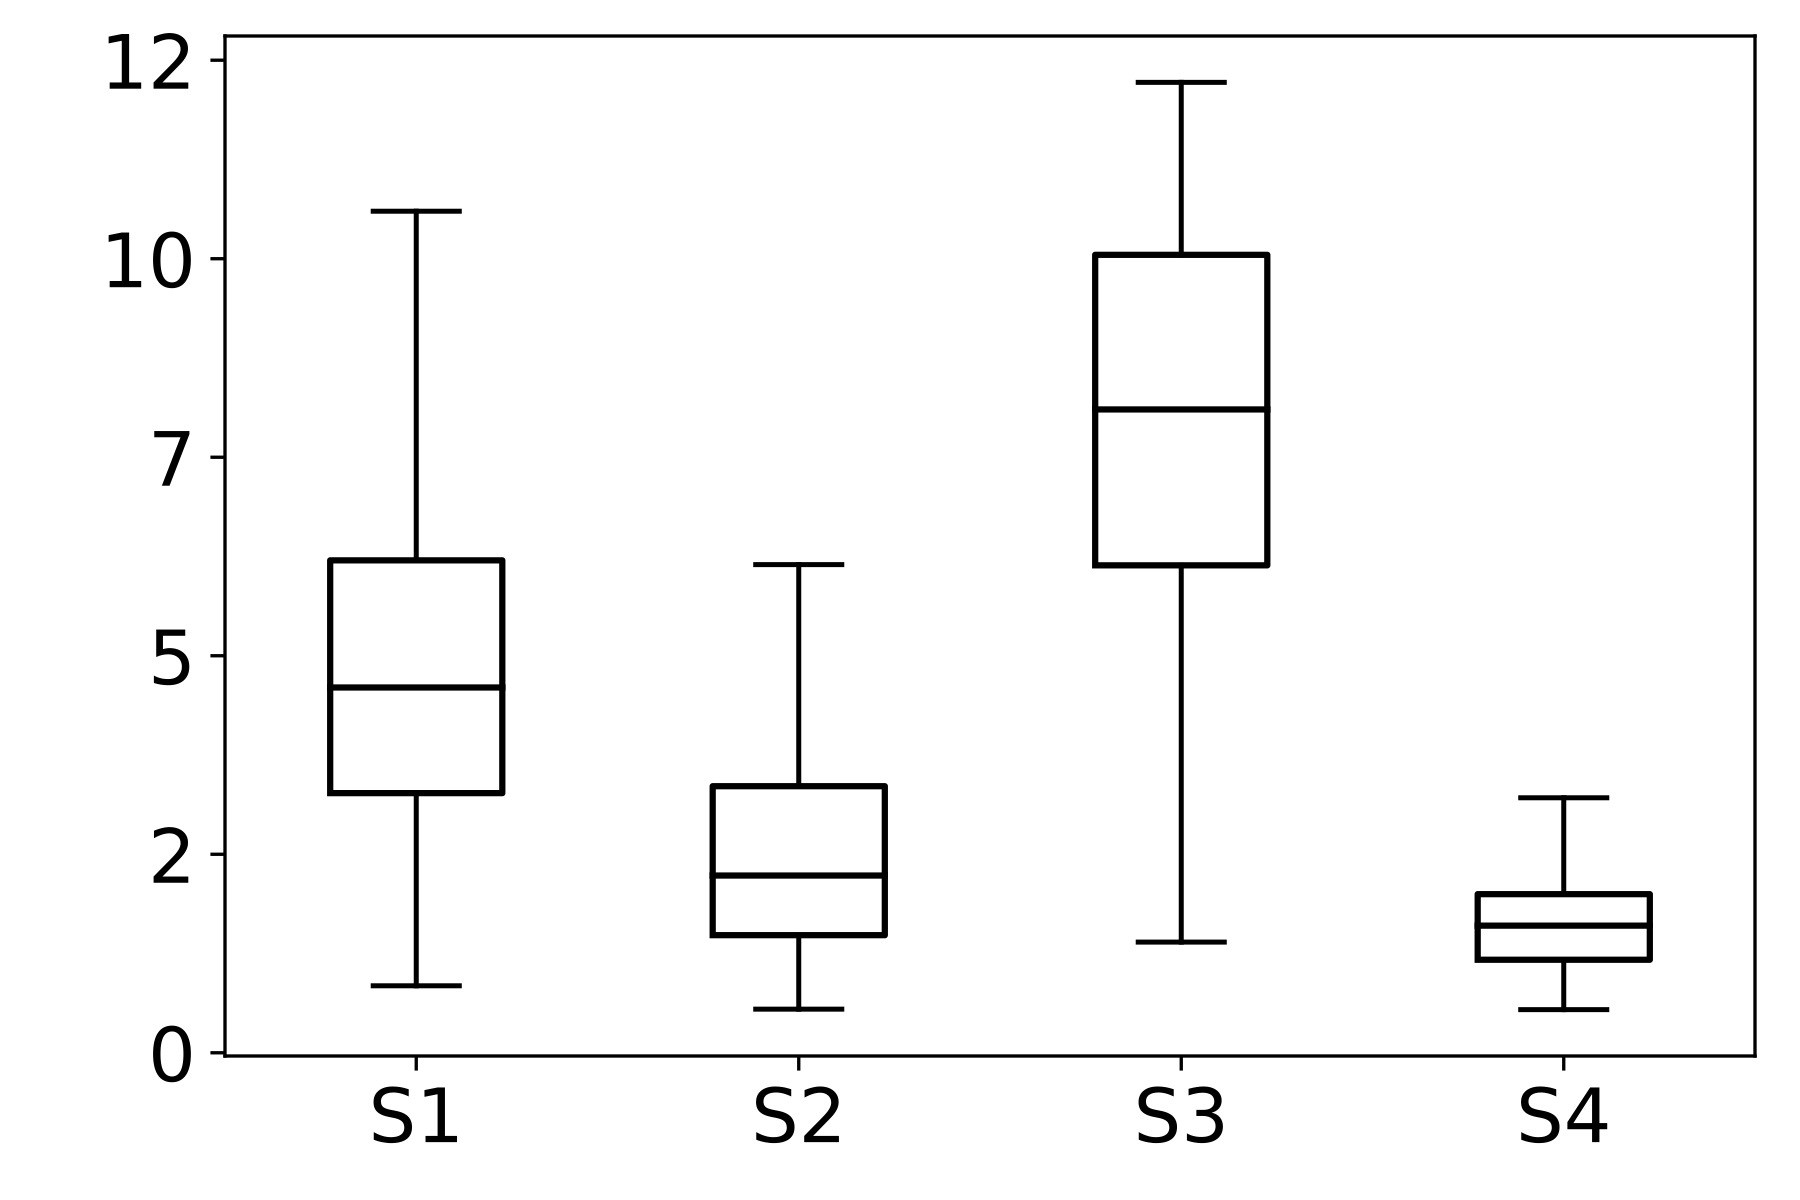
Figure 2 : Empirical Analysis of Stain-Dependent Focus Behavior: (a) Mean spatial frequency (SF) versus focus rank for three datasets; the shaded region indicates ±1 standard deviation across samples. SF decreases monotonically with increasing rank, confirming that SF reliably captures focus degradation. (b)–(d) Boxplots of SF values across stains for each dataset (x-axis: stain identity, y-axis: SF distribution). FocusPath shows stain-invariant SF trends, wherease BBBC006 and FluoMix display pronounced stain-dependent variability.
Spatial Frequency (SF) Metric
In our analysis, we utilize the Spatial Frequency (SF) metric as a quantitative proxy for image sharpness to analyze stain-dependent focus behavior. Higher SF values indicate sharper, more in-focus images.
Given an image $I \in \mathbb{R}^{M \times N}$, the row frequency ($RF$) and column frequency ($CF$) components are defined as:
\[RF = \sqrt{\frac{1}{(M-1)N} \sum_{i=1}^{M-1}\sum_{j=1}^{N} (I(i+1,j)-I(i,j))^2}\] \[CF = \sqrt{\frac{1}{M(N-1)} \sum_{i=1}^{M}\sum_{j=1}^{N-1} (I(i,j+1)-I(i,j))^2}\]The overall Spatial Frequency ($SF$) is then calculated as:
\[SF = \sqrt{RF^2 + CF^2}\]Source: Image quality measures and their performance. IEEE Trans. Commun..
Citation
@article{park2026fluoclip,
  title={FluoCLIP: Stain-Aware Focus Quality Assessment in Fluorescence Microscopy},
  author={Park, Hyejin and Yoon, Jiwon and Park, Sumin and Kim, Suree and Jang, Sinae and Lee, Eunsoo and Kang, Dongmin and Min, Dongbo},
  journal={arXiv preprint arXiv:2602.23791},
  year={2026}
}